01
Sales pipeline & conversion
Visual funnel of leads → quoted → won, with conversion rates between each stage and trend lines for the past 12 months.
Eight built-in reports turn your day-to-day work into clear, actionable numbers. Sales pipeline, conversion, revenue, aged debt, profit and team workload - all live, all filterable, no spreadsheets required.
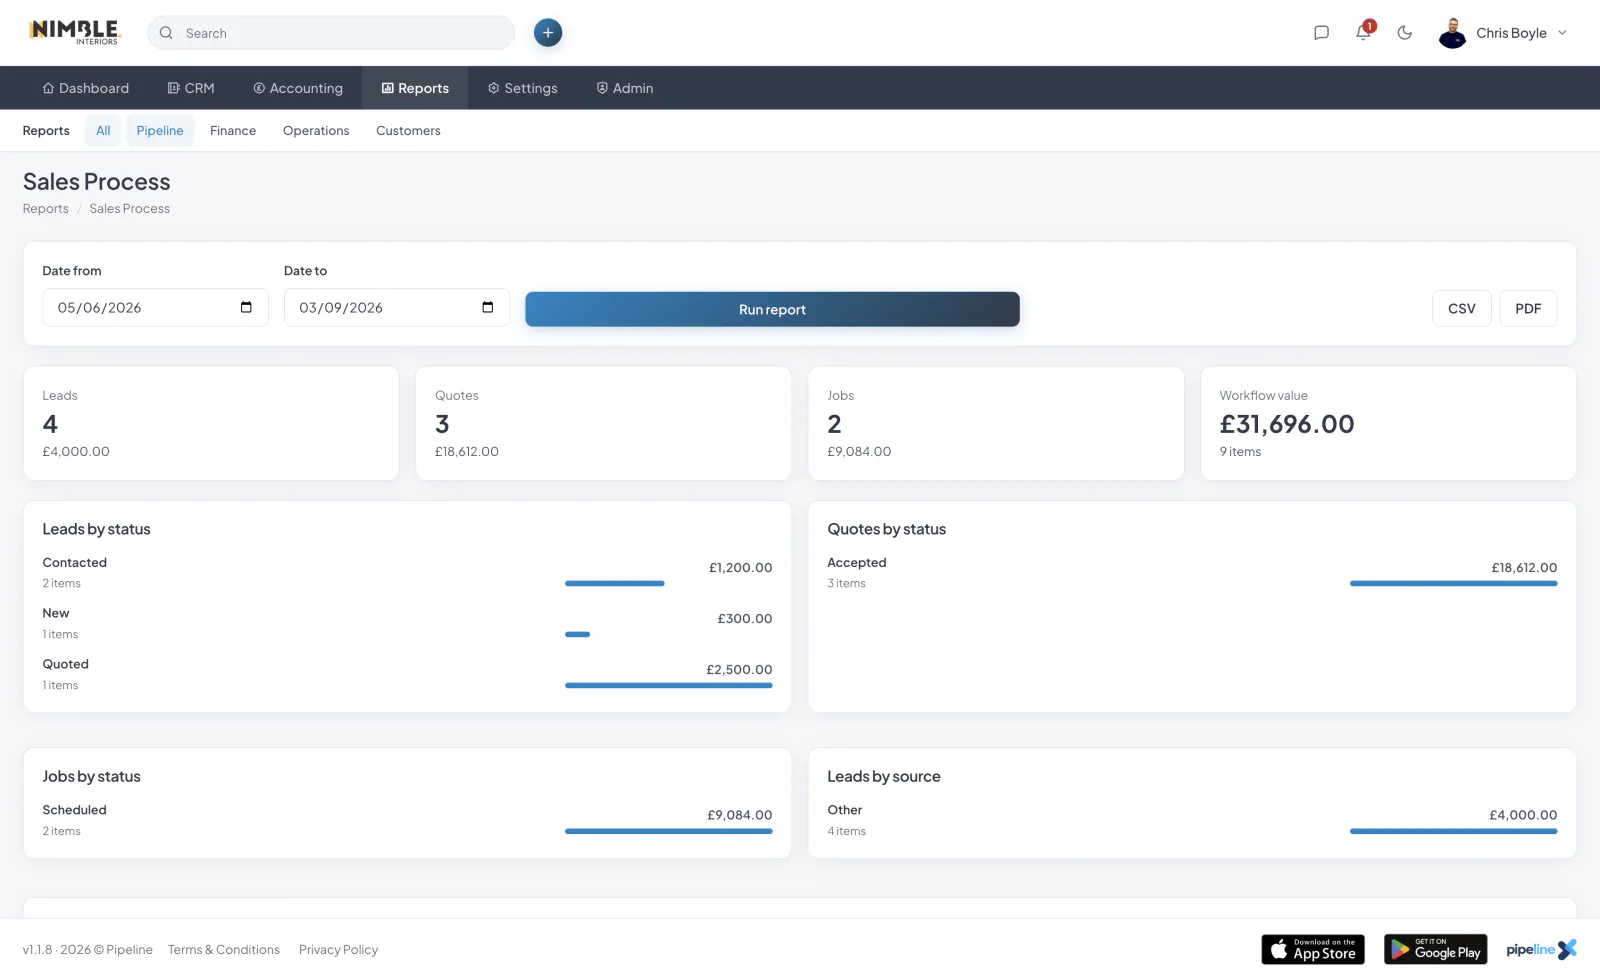
Visual funnel of leads → quoted → won, with conversion rates between each stage and trend lines for the past 12 months.
Total invoiced, paid and outstanding revenue by month and customer. Overdue invoices sliced into 0-30, 31-60, 61-90 and 90+ day buckets.
Compare quoted price to actual costs on every job. See expense breakdowns by supplier and category, and net profit by month.
Who is overbooked, who has capacity, and what every customer has spent over their lifetime - all in one place.
All eight reports update live as your team works. Filter by date, customer, team member or service - then export any view to CSV or PDF.
See every lead, quote and deal in flight - by stage, value, source and owner.
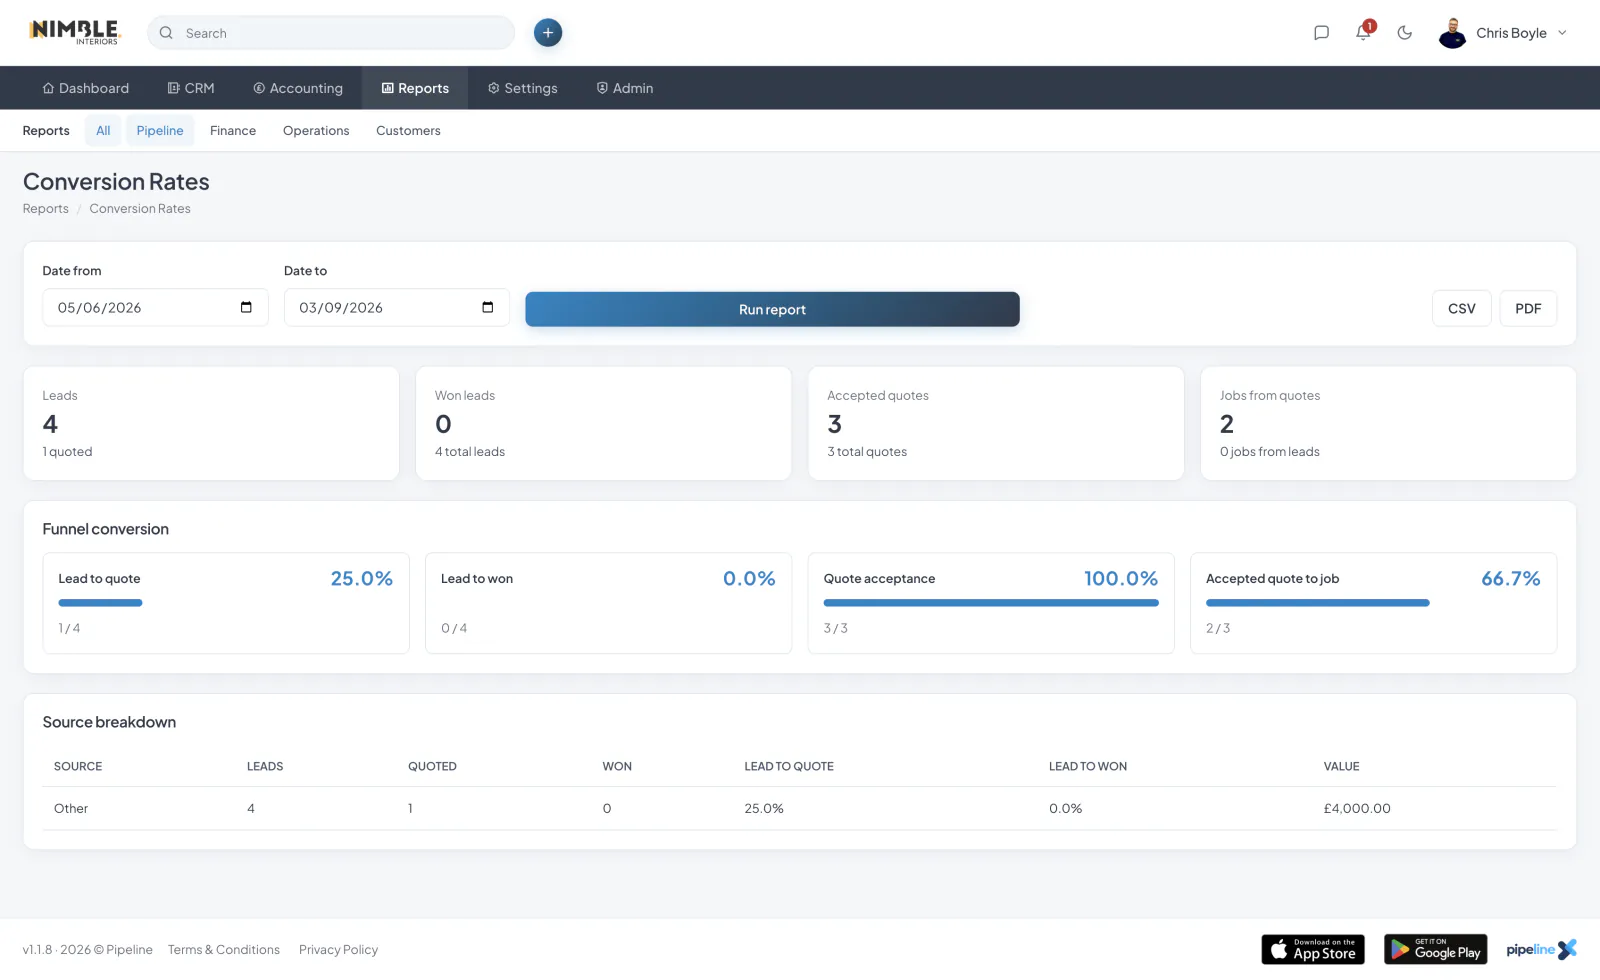
Track how many enquiries turn into quotes, jobs and paid invoices over time.
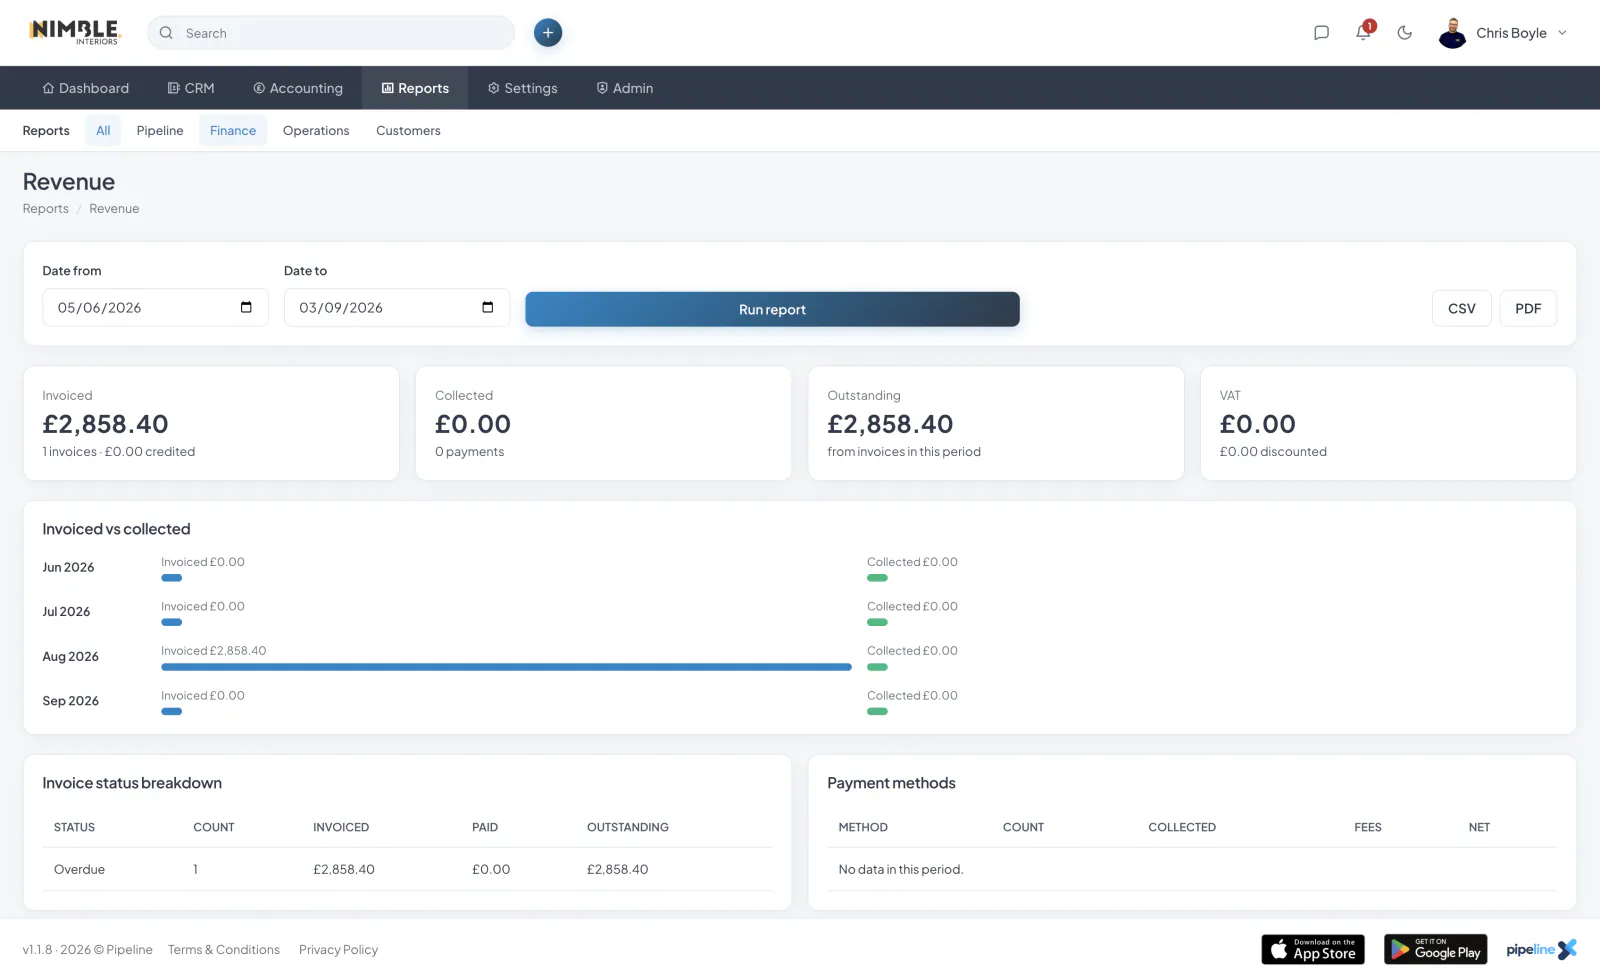
Total invoiced, paid and outstanding revenue - by month, customer or service type.
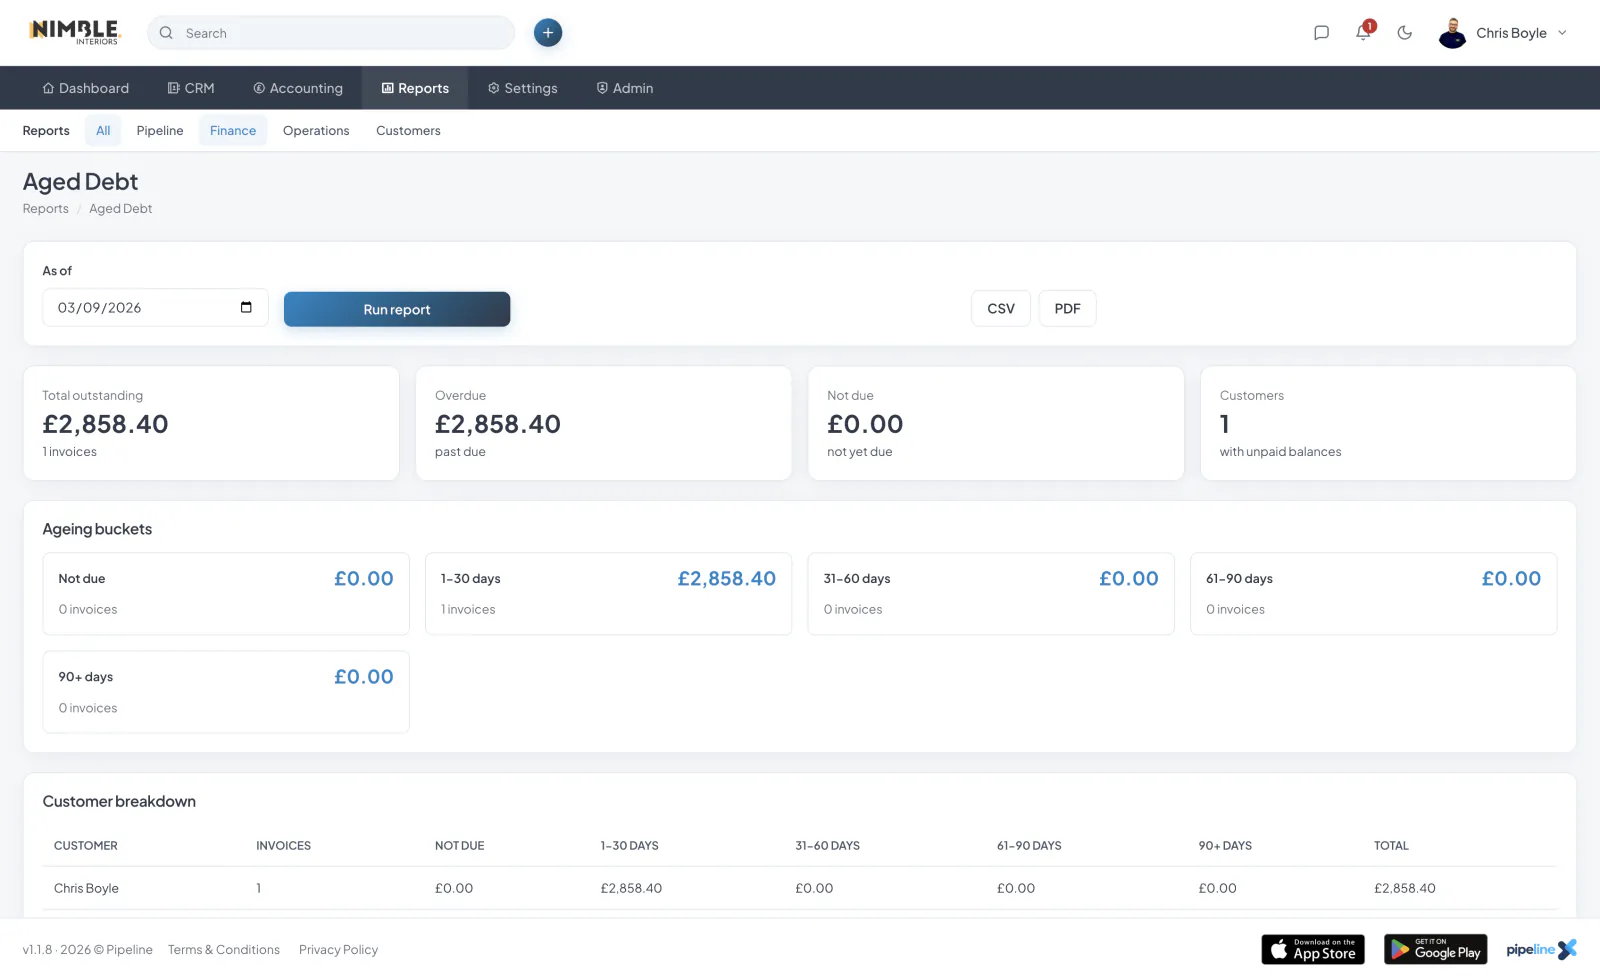
Spot overdue invoices fast - sliced into 0-30, 31-60, 61-90 and 90+ day buckets.
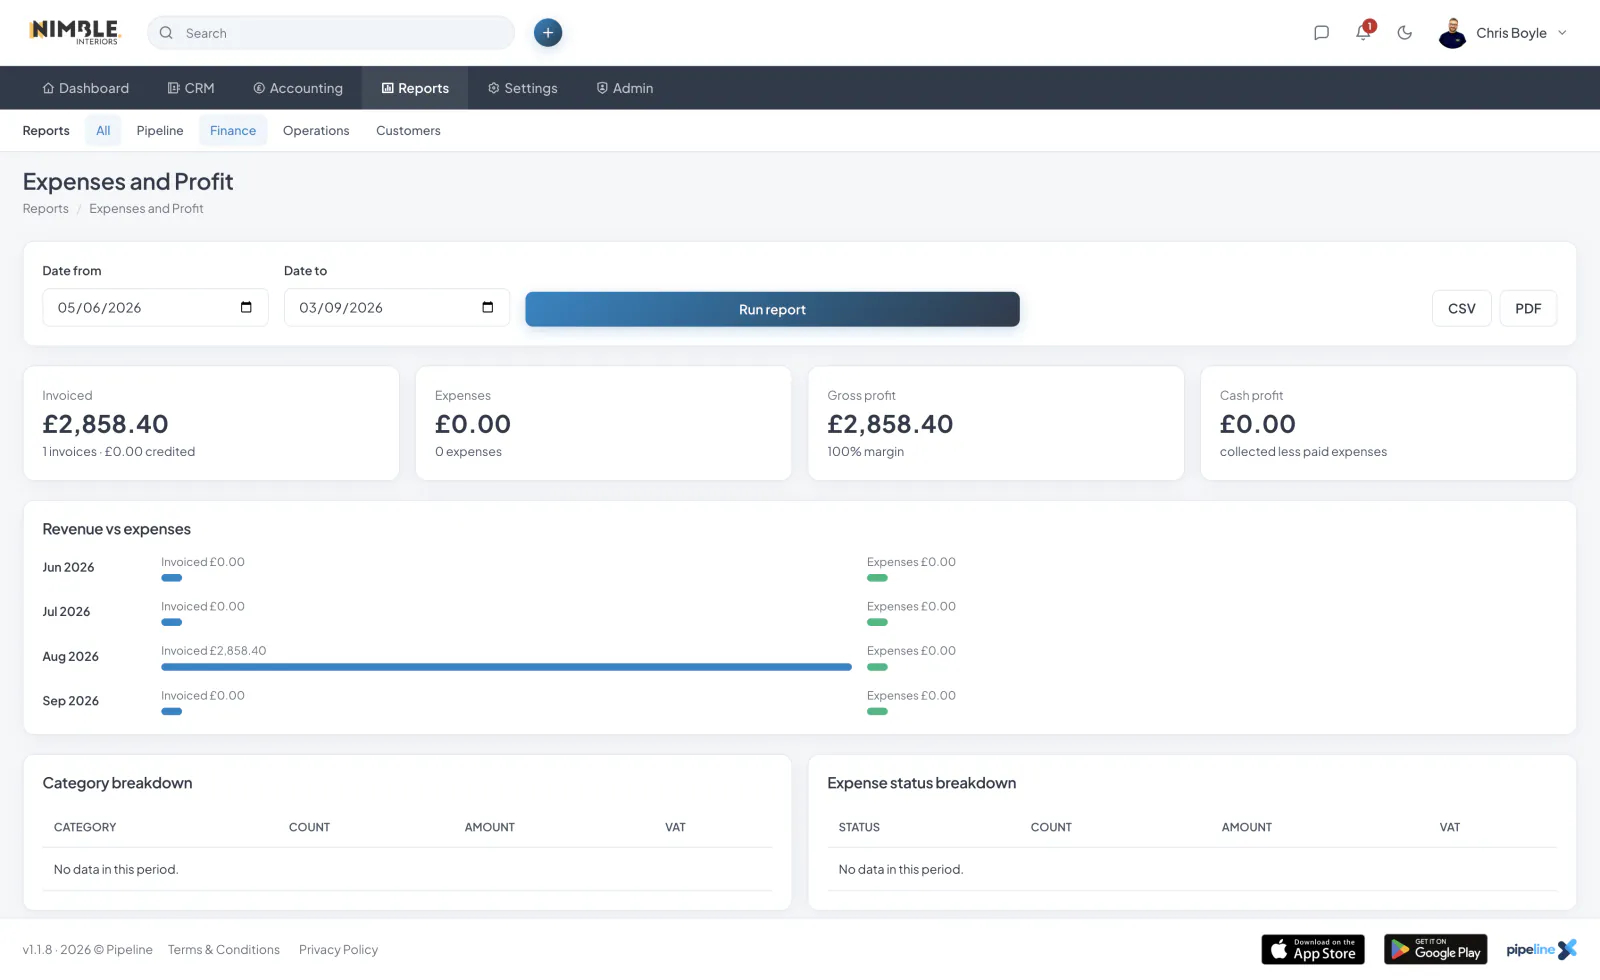
Where the money goes. Track spend by supplier, category and job - and what is left.
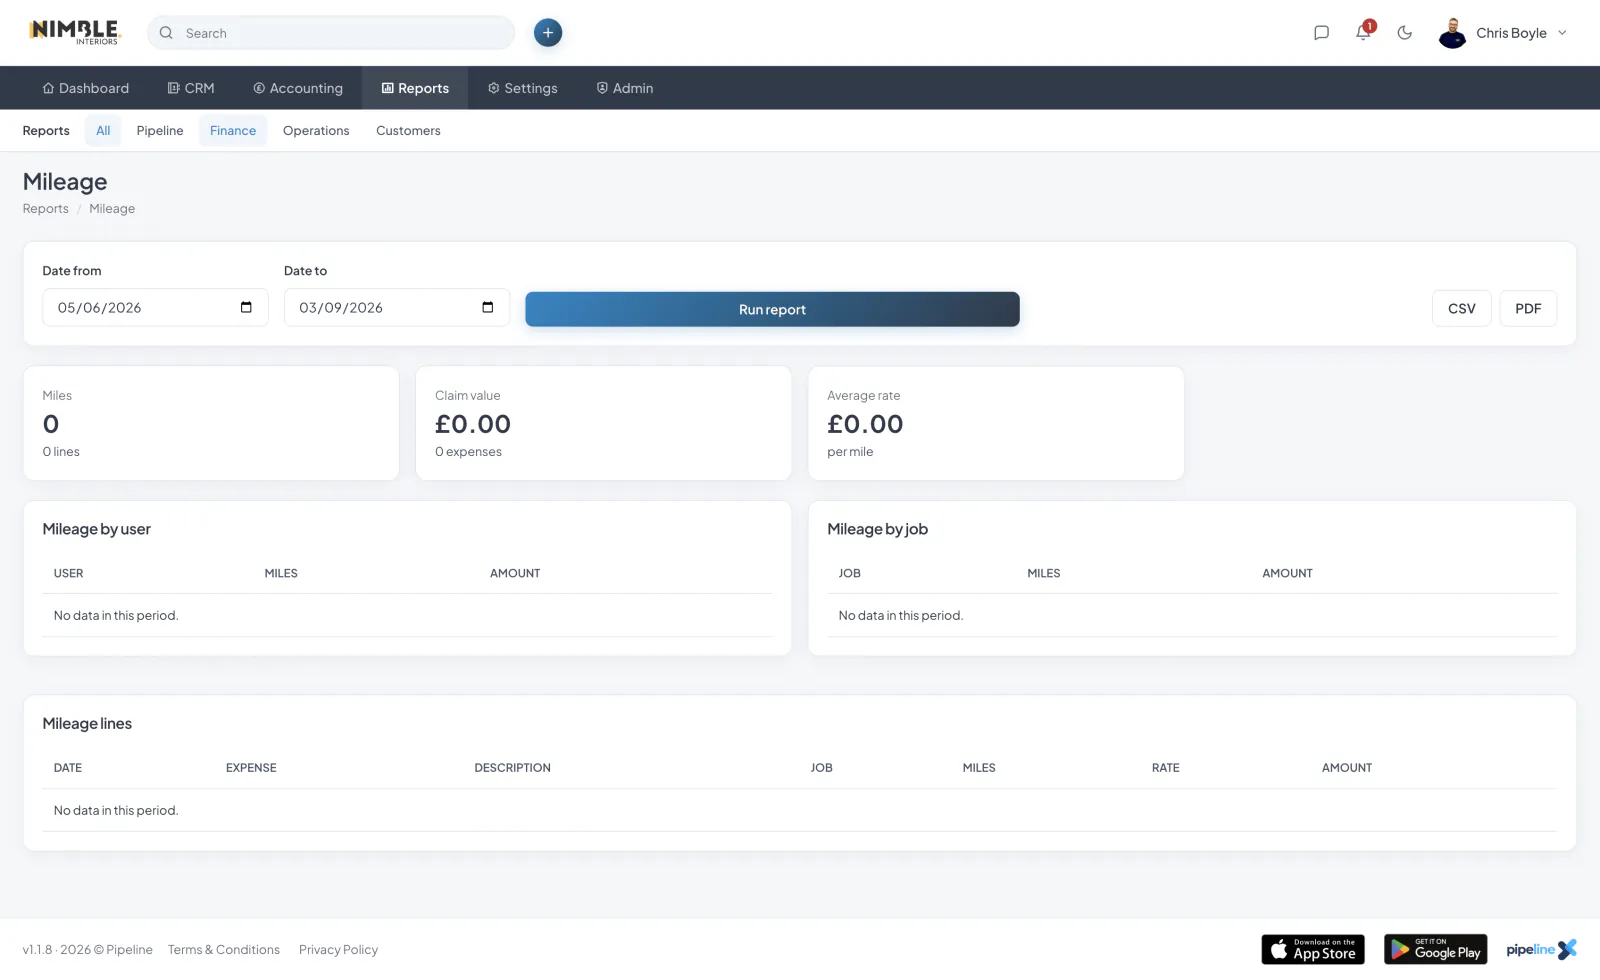
Mileage by user, job and claim value so reimbursements are easy to check.
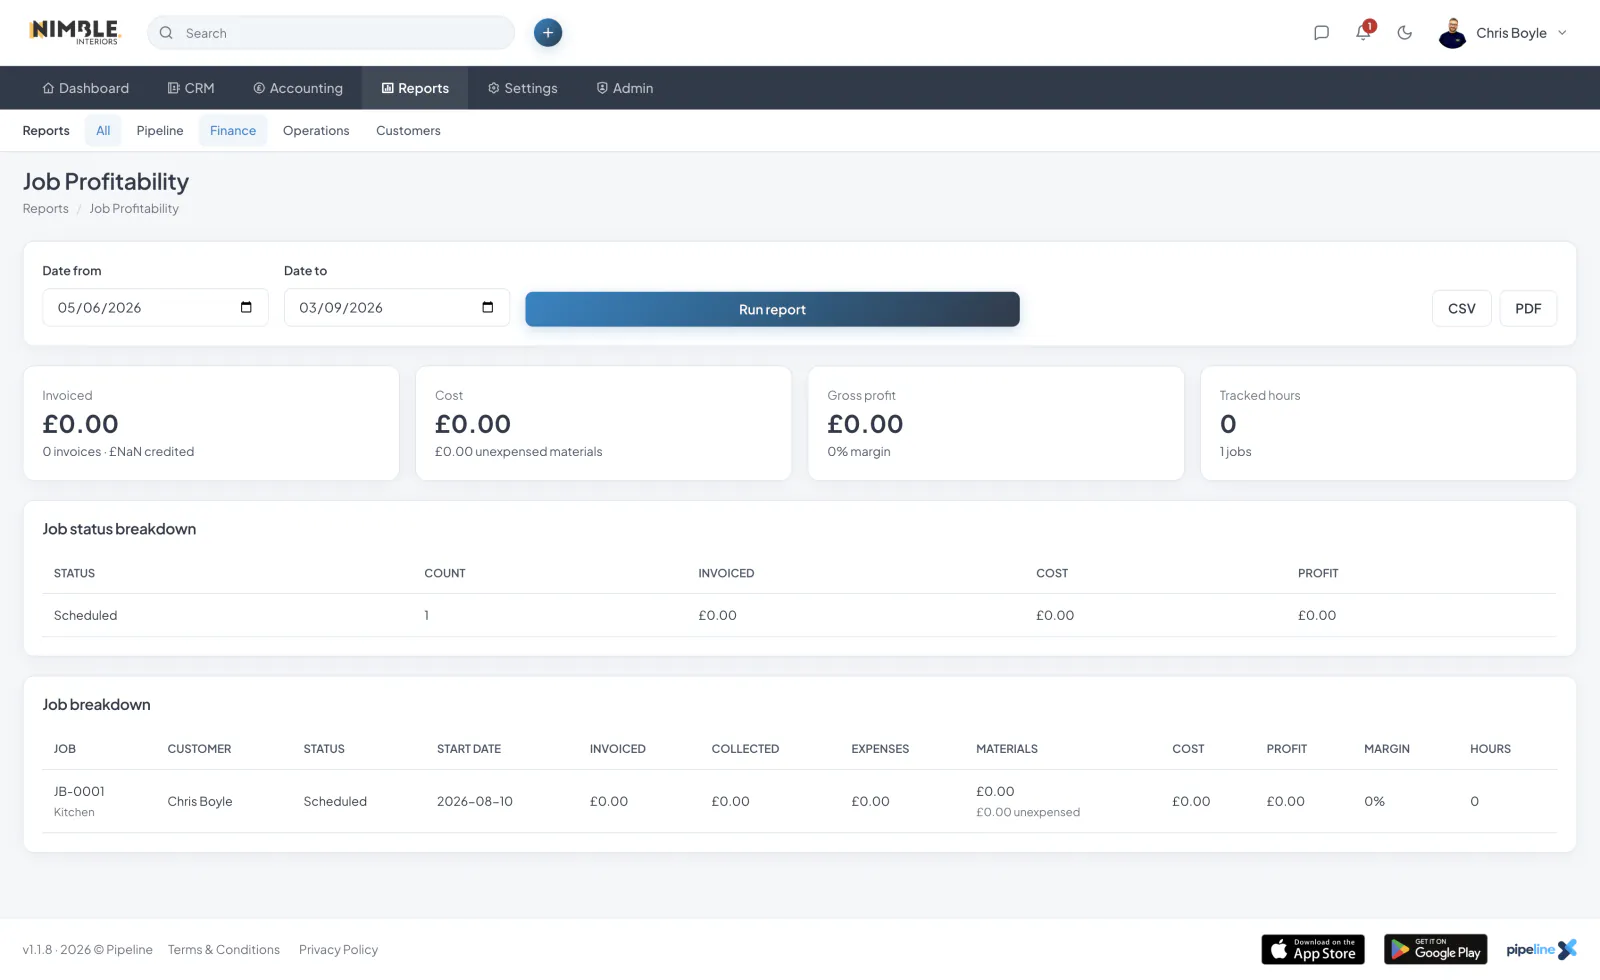
Know which jobs really make money. Compare quoted price, actual costs and margin.
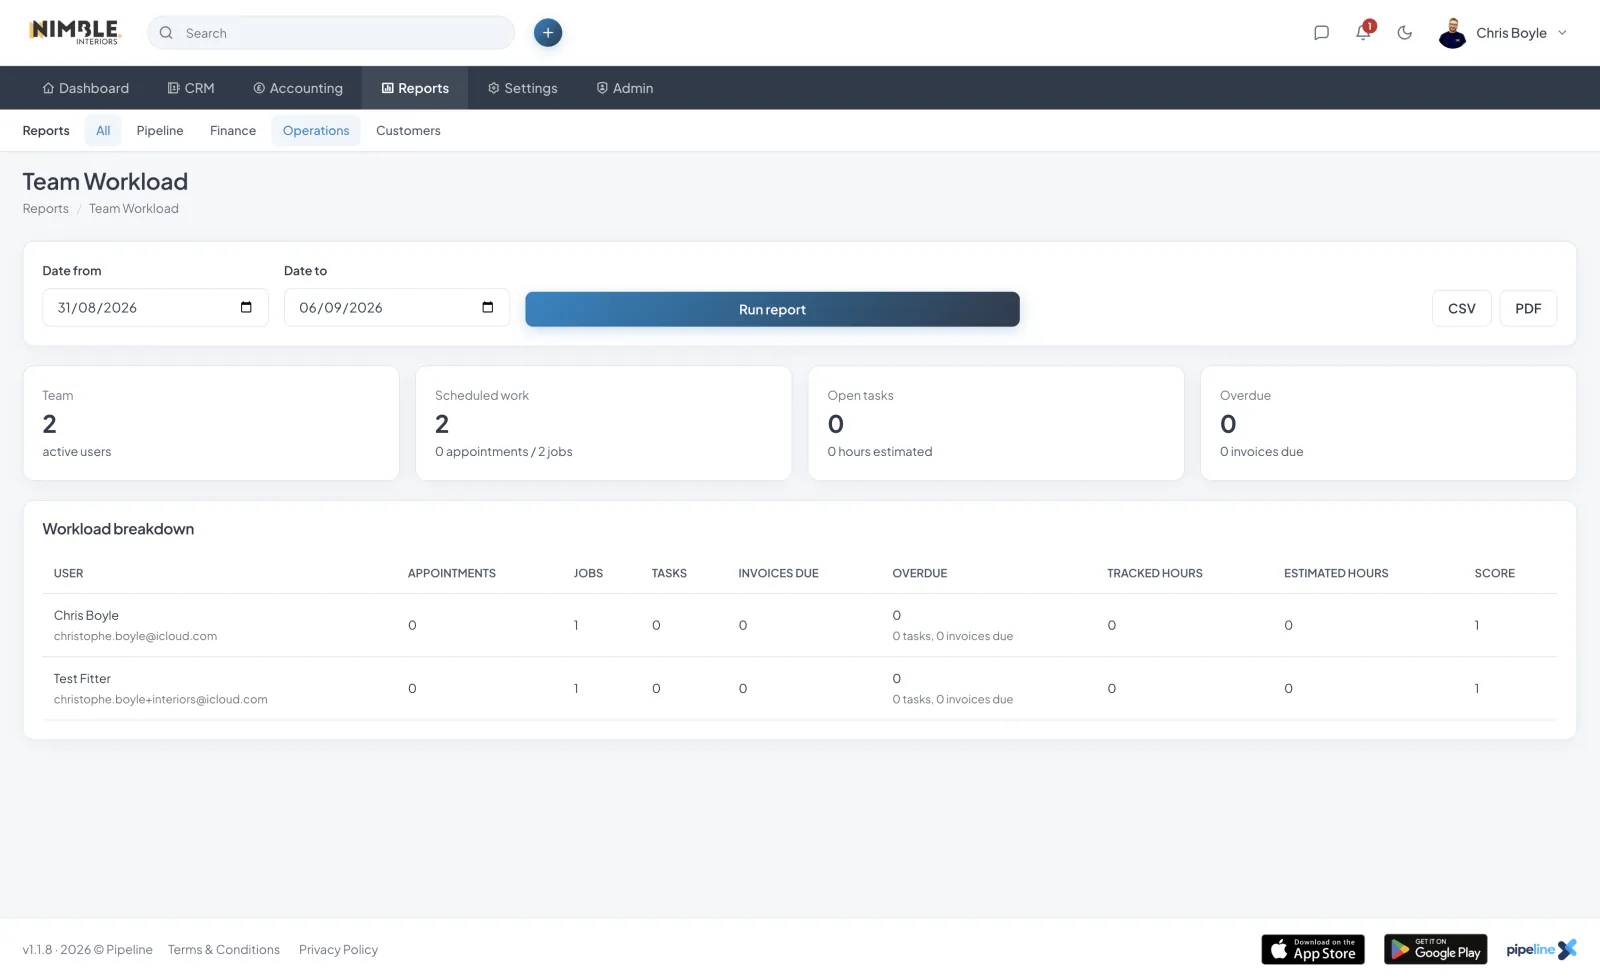
See who is overbooked and who has capacity. Balance jobs across your team in seconds.
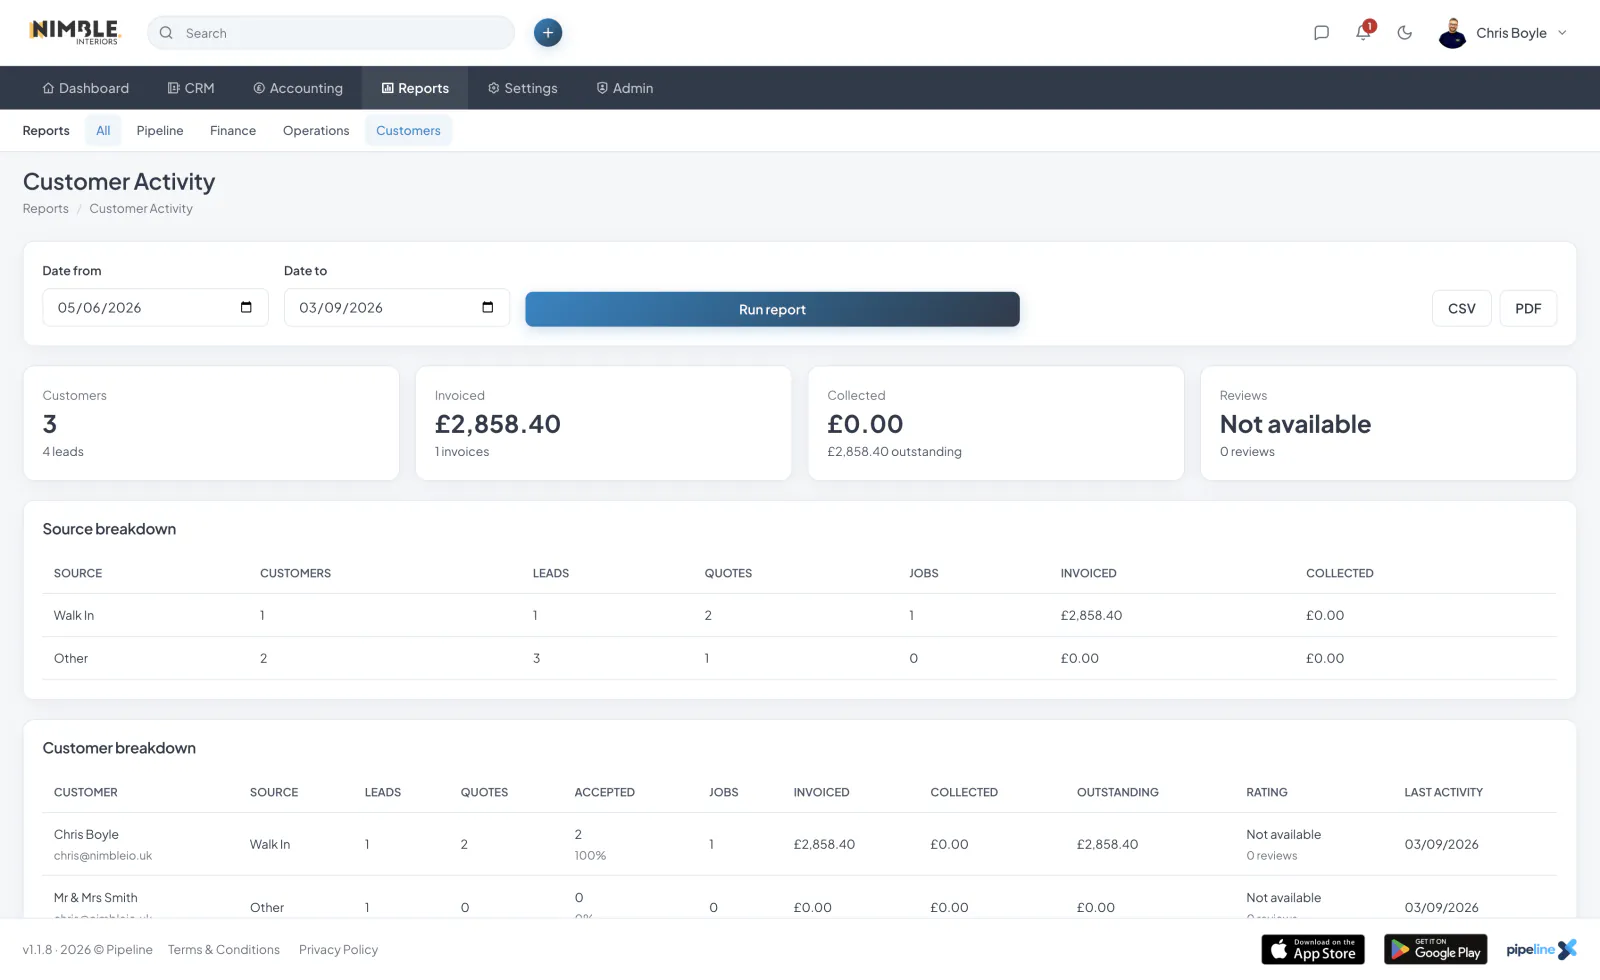
Lifetime view of every customer - quotes, jobs, spend, last contact, lifetime value.
Start a 7-day free trial. Cancel anytime.
Join the Pipeline mailing list and we’ll send you a discount code for 50% off your first three months.
That’s three months of fewer spreadsheets, fewer missed leads and considerably less shouting, “Who booked that job?”
We’ll also send occasional Pipeline news and useful updates. No spam, no daily motivational quotes. Unsubscribe whenever you like.
Offer available to new Pipeline customers only.